Aseptic processing can be defined as the processing and packaging of a commercially sterile product into sterilised containers followed by hermetic sealing with a sterilised closure that prevents viable microbiological recontamination of the sterile product. Manufacturing of aseptic products is performed in the ‘aseptic’ processing area, which prevents contamination by excluding microorganisms during processing. The basic principle of aseptic processing is,
1. All component(s) and product introduced in the aseptic processing area are sterile and
2. The manufacturing process inside the aseptic processing area does not generate and controls the particulate counts, which may pose a risk to the Safety, Identity, Strength, Purity, and Quality of the product.
Current technology enables to validate and routinely verify sterilization processes for component(s) and products introduced in the aseptic processing area. Though advanced aseptic technologies like Restricted Barrier Access (RABS) system, isolator technology, single-use technology, and aseptic connectors have reduced human factor, which is one of the largest sources of contamination in the aseptic processing area, none of these technologies provides similar assurance (to sterilization process) during aseptic processing by which manufacturer can evidently claim that the drug product is sterile.
It is discussed in many microbiology forums the term sterile means ‘absence of all viable microorganism’ is debatable for an aseptically manufactured product. It can only be considered in terms of probability. This is because absolute sterility can only be proved by testing every single unit, which is not practically possible.
Therefore, a robust, risk-based environment monitoring program is required to provide sufficient information to the manufacturer and regulator to demonstrate that the aseptic processing environment is operating inadequate control and ensure the end-product meets predefined critical quality attributes.
Regulatory aspect of environment monitoring
Table 1.1: Cleanroom Standards, Airborne particulate limit (Particle/M3)
Particle Size | ISO 14644: 2015 | USFDA (Aseptic Processing Guidance) | USP <1116> | EU Annex 1 |
– | ISO 5 | Class 100 | ISO 5/Class 100 | Grade A Grade B (At Rest) |
≥0.5µ | 3520 | 3520 | 3520 | 3520 |
≥5µ | Not Specified | Not Specified | Not Specified | 20 |
– | ISO 6 | Class 1000 | ISO 6/Class 1000 | Not Applicable |
≥0.5µ | 35,200 | 35,200 | 35,200 | Not applicable |
≥5µ | 293 | Not Specified | Not Specified | Not applicable |
– | ISO 7 | Class 10,000 | ISO 7/ Class 10,000 | Grade B (in operation) Grade C (at rest) |
≥0.5µ | 352,000 | 352,000 | 352,000 | 352,000 |
≥5µ | 2,930 | Not specified | Not specified | 2900 |
– | ISO 8 | Class 100,000 | ISO 8/ Class 100,000 | Grade C (in operation) Grade D (at rest) |
≥0.5µ | 3,520,000 | 3,520,000 | 3,520,000 | 3,520,000 |
≥5µ | 29,300 | Not specified | Not specified | 29,000 |
Table 1.2: Environment monitoring requirement:
Monitoring Guidance | USFDA (Aseptic Processing Guidance) | USP <1116> | EU Annex 1 |
Frequency (Airborne total particulate and viable count. Personnel Sampling as noted) | Class 100: Each production shift; Gloves: Daily for each lot
Other classes not specified. | Critical zone (ISO 5): Active air sampling: Each operational shift; Surface monitoring: End of operation Adjacent to Critical zone: End of operating shift Other areas (ISO 7, ISO 8): Once per day | Grade A: In operation, continuous particulate monitoring required for critical operation. Frequent viable monitoring. Grade B: In operation, frequent particle monitoring is required. Grade C, D: Monitoring on risk basis, in operation. Surfaces and personnel should be monitored after critical operations. |
Airborne viable action levels (Active air sampling) | ISO 5/Class 100: 1 CFU/m3 ISO 6/ Class 1000: 7 CFU/m3 ISO 7/ Class 10,000: 10 CFU/m3 ISO 8/ Class 100,000: 100 CFU/m3 | Recommends use of incident rate (% of samples with micro contamination) rather than count level, as follows:
ISO 5: < 1% ISO 6: < 3% ISO 7: <5% ISO 8: <10%
Applies to all active air, passive air and surface samples. | A: <1 CFU/m3 B: 10 CFU/M3 C: 100 CFU/M3 D: 200 CFU/M3 |
Airborne viable action levels (Passive air sampling) | ISO 5/Class 100: 1 CFU ISO 6/ Class 1000: 3 CFU ISO 7/ Class 10,000: 5 CFU ISO 8/ Class 100,000: 50 CFU
90mm diameter settle plate/4 hour. Use of settling plate is optional. | Same sample incident rate as active air.
90mm diameter settle plate/4 hrs. | A: <1 CFU/m3 B: 5 CFU/M3 C: 50 CFU/M3 D: 100 CFU/M3 |
Surface viable action levels | Not specified | Same sample incident rate as active air.
Use contact plate or swab. | A: <1 CFU B: 5 CFU C: 25 CFU D: 50 CFU
55mm diameter contact plate. |
Personnel viable action levels (Gown) | Not specified
Gown sampling must be established based on job responsibility. | Same sample incident rate as active air. | Not specified |
Personnel viable action levels (Gloves) | Not specified | Same sample incident rate as active air. | Glove print, 5 fingers A: <1 CFU/glove B: < 5 CFU/glove |
The significant difference in the environment monitoring approach is between USP <1116> and other regulators; here, USP <1116> talks about percentage incident rate during environment monitoring, whereas other agencies specify an arbitrarily numerical value.
As per USP <1116>, the contamination recovery rate is the rate at which environmental samples are found to contain any level of contamination. For example, an incident rate of 1% would mean that only 1% of the samples taken have any contamination regardless of colony number. For example, one plate is showing microbial growth out of 100 plates exposed in the respective area. USP <1116> also specifies that there can not be the same limit having common area classification but different criticality, which is not the case for other regulatory agencies ‘ guidance document(s). USP <1116> suggests using prospective risk analysis and statistic tools to define an area-specific limit.
The rationale behind evaluating percentage incident rate compared to arbitrary value is the limitation of the environment monitoring method of quantifying observed CFU(s). During experiments, it is identified that the detectable limit for environment monitoring sample is between 10 to 100 CFUs/Plate, whereas most of the limits or observed values during routine environment monitoring are either zero or below 10 CFUs/Plate. Due to high variation in microbiological test results, there is no meaningful difference in observed value whether it is 1 CFU/Plate or 5 CFU/Plate; the difference is meaningful when it is a logarithmic scale.
The second reason for USP <1116> is the contamination recovery rate approach because there is no standard sampling method available for environment monitoring. It is impossible to reproduce the same result by sampling the same volume by different methods (and different organizations). The second rationale is that, sample to sample variation is in microbiological methods.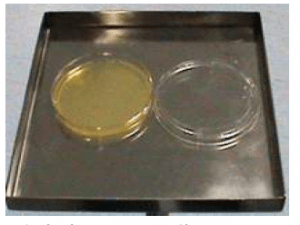
Another difference in acceptable limit is while EU Annex 1 is laying acceptance criteria for ‘At rest’ and ‘In operation’ separately, US FDA in Aseptic processing guidance, 2004 and USP <1116> defines a limit for environment monitoring ‘in operation’ only.
Environment monitoring and excursion management
Challenge(s) for environment monitoring of viable particulate in the aseptic processing area is limited (or statistically insignificant). Sampling and no immediate visibility of the result of the test being performed; when the result of environment monitoring is known, the large amount of air changes (and batch processing) is already done!!
Like one famous quote in microbiology, “Bugs Don’t Lie,” if an environment monitoring program is designed by accessing all associated risks for frequencies and monitoring locations, microorganism(s) will indeed indicate the state of control of the environment of the facility. Environment monitoring has been a significant source of FDA scrutiny during sterile drug substance and drug product manufacturing inspection and a major contributor of FDA-483.
As mentioned in the previous section, microbial environment monitoring cannot identify and quantify all microbial contaminants in the room due to the limitation of sample size and equipment limitation. Due to inherent variability in microbiological analysis, any single isolated excursion may not establish a definitive cause; in isolated excursion incidents, only general corrective measures can be considered rather than full-fledged investigation and corrective actions.
Statistical tools shall be applied to organize and present microbial environmental monitoring data to evaluate it against regulatory action limits and determine if the aseptic processing area is in a state of control. In modern, clean rooms of higher classification or critical zone, most of the time, environment monitoring counts are ‘Zero’. In case most data are “zero”, statistical analysis becomes difficult. No regulatory guidance document suggests remediation of the same; in industry, 95 percentile (for alert limit) and 99 percentile (for action limit) and normal distribution approach i.e., three standard deviations (for the alert) and six standard deviation approaches are prevalent. However, the company can adopt another suitable statistical approach also.
Number-based and bacterial species-based trend analysis are useful tools to ensure the state of control of the area. Any gradual increase of microbial counts or change in the microbial flora shall trigger an investigation and corrective actions.
The identity of the organisms recovered is an essential factor in the conduct of this investigation. Grade A/B recoveries that exceed action limits shall be identified to species level; all recoveries during media fills are identified up to species level using the genotypic method. Recoveries in Grade C/D shall be identified up to genus or species level (based on phenotypic method). Environmental excursions shall be linked with batch release and CAPA program.
In case of adverse trend is identified, the manufacturer needs to revisit the following but not limited to,
- The area cleaning and sanitization program includes a selection of disinfectants, cleaning process, and frequencies.
- The person qualification, training program and aseptic behaviour of person working inside the aseptic processing area. As suggested by FDA in Sterile Drug Produced by aseptic processing, quality unit oversight is required.
- Review of microbiological sampling methods and techniques.
- In some severe cases, review of engineering aspects of facility like HEPA integrity, air changes,
- Quality management aspects like recent change controls, related to process or facility changes.
It is common practice to rotate disinfectant used to sanitize the aseptic processing area at regular intervals. The rationale behind rotation is the development of microbial resistance to disinfectants. However, the likelihood of this phenomena is very less as disinfectants are more powerful biocidal agents. Besides, they are usually applied in high concentrations against low populations of microorganisms, usually not growing actively, so the selective pressure for resistance development is less profound.
However, the rotation of an effective bactericidal disinfectant with one sporicidal disinfectant is encouraged. It is prudent to augment a bactericidal disinfectant for daily use. Sporicidal agents’ daily application is not generally favoured because they tended to corrode equipment and because of the potential safety issues with chronic operator exposure. The sporicidal agent is recommended for weekly or monthly use.
Other harmonization areas,
Although there are good amount of harmonization between environment monitoring methods, there are variations in some of the aspects like,
- Incubation Temperature Regimen: While Tryptic Soy Agar (TSA) is widely used for environment monitoring, different companies have different approaches for incubation temperature regimens. USP <1116> cites temperature range from 20oC to 35oC for no less than 72 hours for incubation; however, in industry two temperature regimen, 20oC to 25oC for no less than 72 hours followed by 30oC to 35oC for no less than 48 hours in sequence; and 30oC to 35oC for no less than 48 hours followed by 20oC to 25oC for no less than 72 hours in the sequence are prevailing. Experiments have suggested that there is no significant difference in any of the regimens and both are acceptable. However, once adopted, if any change is required shall be done by the change management system.
- Use of settle plate for environment monitoring: In FDA’s aseptic processing guidance, use of settle plate is considered optional, but there are no such leverages given in USP <1116> and EU Annex 1. More Than 90% of companies prefer the settle plate sampling method for environment monitoring in the filling room (critical zones) environment in a recent PDA survey.
- Anaerobic environment monitoring: No regulatory guidance suggests monitoring the aseptic processing area for the presence of the anaerobic microorganism. During the PDA survey, it was identified that around 40% of companies do not perform sampling for the anaerobic organism; 65% of companies believe that anaerobic monitoring does not reflect the anaerobic condition of the room.
- Environment Isolate storage: Environment isolates identified in the critical zone, abnormal trend or media fill or product failure shall be characterized, identified, and a library shall be prepared. This library can be in the form of photographs and documents or preserved culture.
Technological evolution:
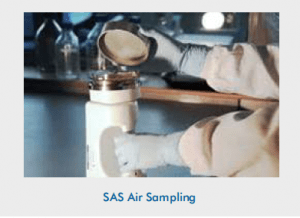
Longer incubation time, manual observation of exposed plates, and paper-based documentation are the major drawbacks of Quality Control, microbiology section. However, technological evolution is happening in the industry to address these issues. Following are some examples,
Rapid Microbiology: Bio-fluorescence particle counting (BFPC) is a new rapid microbiological method for monitoring airborne microbes.
It provides continuous information on particle count, size, and auto-fluorescence. The technology is based on laser excitation of particles to detect biofluorescence of biological compounds such as: nicotinamide adenine dinucleotide (NADH), riboflavin, and picolinic acid which are universally found in all microorganisms. Currently, some BFPC systems cannot distinguish between viable particles and other compounds (such as polymers or solvents) that may fluoresce; to help distinguish false positives from viable cells, the use of qualitative sample capture onto media or filters can help determine microbial identification. In addition to the quick result, the advantage of this technology is that it can detect viable but not cultural organisms.
Alternatively, technology is also evolved for rapid and automatic detection of colony-forming units. With this technology, the colony-forming unit can be detected in half the time traditional methods. i.e., in 2.5 days instead of 5 days. The system allows adjustable single temperature incubation or dual temperature incubation as per user convenience and procedure. The system uses the same traditional media with added fluorescent dye in it. As in the second method,
there is no change in media or incubation regimen. It may lead to lesser regulator’s scrutiny.
Automatic colony counter: To mitigate the risk of manual counting of colony, the automatic colony counters are widely accepted by the pharmaceutical industry. This colony counter works on the detection of density change in agar due to microbial growth. Each plate is photographed and saved in the archive for investigation required, if any, and these instruments are 21 CRF Part 11 compliant for data integrity.
Environment monitoring management software: Documentation in QC Microbiology is mostly paper-based, which is labor-intensive and may lead to human error and regulator’s observations during the inspection. Many software is now available that not only eliminates unnecessary time and Cost Associated with Paper-based QC Methods but also automates their data collection from devices and people to eliminate redundant data entry and transcription errors.
The system provides a Mobile Data Acquisition Platform and can be integrated with other software too. This software helps in trending and statistical analysis of environment monitoring data and gives better visual control on the aseptic processing area.

References
- Fundamentals of an Environment monitoring program, PDA Technical Report 13, 2014
- Guidance for industry, Sterile Drug Produced by aseptic processing – Current Good manufacturing practices, 2004
- Pharmaceutical Microbiology Manual, 2014
- USP <1116>, Microbiological control and monitoring of aseptic processing environments, USP 42 NF37 2S
- ISO 14644-1: 2015: Cleanrooms and associated controlled environment, Part 1: Classification of air cleanliness by particle concentration.
- EU Guidelines to Good Manufacturing Practice Medicinal Products for Human and Veterinary Use, Annex 1, Manufacture of Sterile Medicinal Products, 2008.
- ISPE baseline pharmaceutical engineering guide, volume 3, Sterile product manufacturing facility
- PDA 2017 aseptic processing survey


