This article outlines the performance superiority on an innovative engineering concept deployed in a hard-gelatin capsule filling machine for powder filling in a tamping-type machine. The treatise is based on statistical observation on the output of the machine in terms of superior weight control, powder saving and reduced operational time.

Empirical Setup for Trial

In the studies given below, two capsule filling machines are considered. One is tagged as ‘PF’ which is a conventional capsule filling machine and the other is tagged as ‘XTR’ which is improvised with an engineering innovation in mechanical design. The following are some basic inputs related to the setup:

Scatter Plot of Capsule Weights of PF Vs XTR

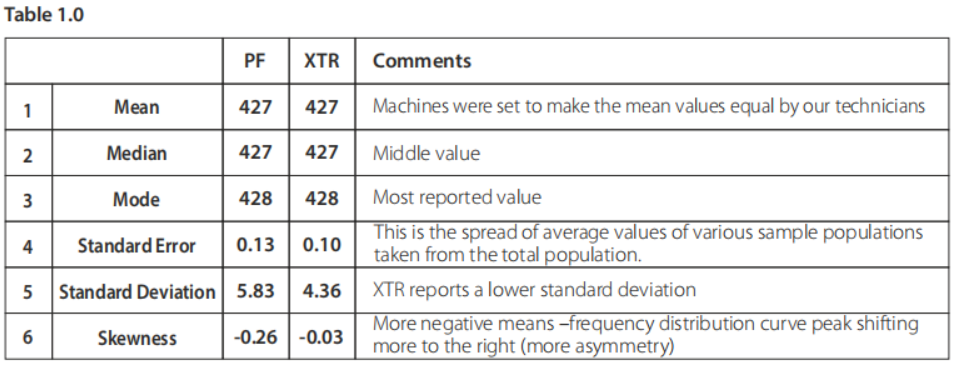
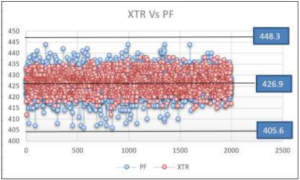
After having collected the capsule weights a scatter plot was used to give a quick comparative visual understanding on the weight-spread from the mean value. As we see above, the average weight of 2000 samples is 427 mg with an upper limit of 5% (448.3 mg) and a lower 5% (405.6 mg). The scatter plot shows that PF has relatively a greater tendency of its capsules weights to approach the upper and lower IP limits. The precarious proximity of PF to the IP limits begs an analysis on its impact on large volumes of capsules generated. The following analysis is to explore if some capsules would make excursions beyond the IP limits, when large campaign batches are run.

Such probabilities are usually estimated using Normal Distribution Curves. These curves are plotted using just two parameters: 1) mean ‘μ’, and 2) standard deviation ‘of the sample population.

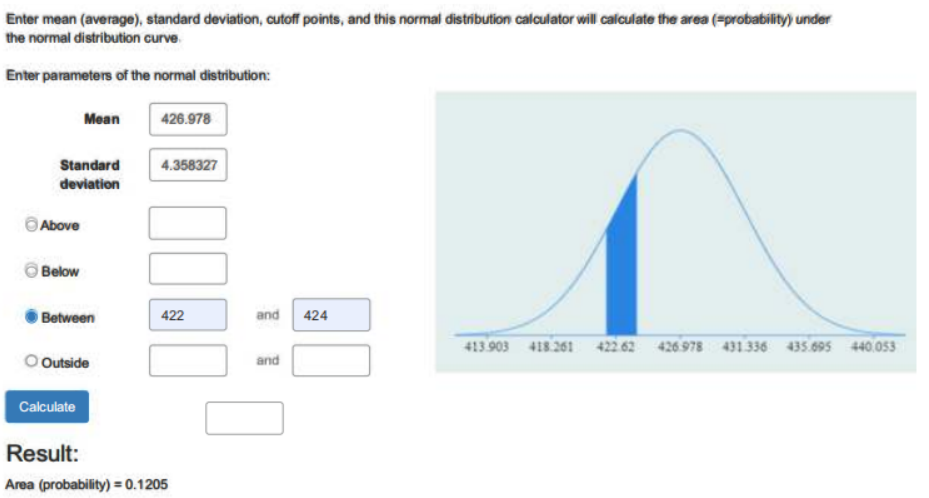
The distribution looks like a bell curve and probability is defined by its area between a range of values. E.g. In the following curve, the blue area corresponds to the probability of the range of capsules observed between 422 mg and 424 mg. At the lower left corner, we see that the value to be 0.1205, which implies that 12 capsules of a randomly picked up 100 capsules would fall into this range.

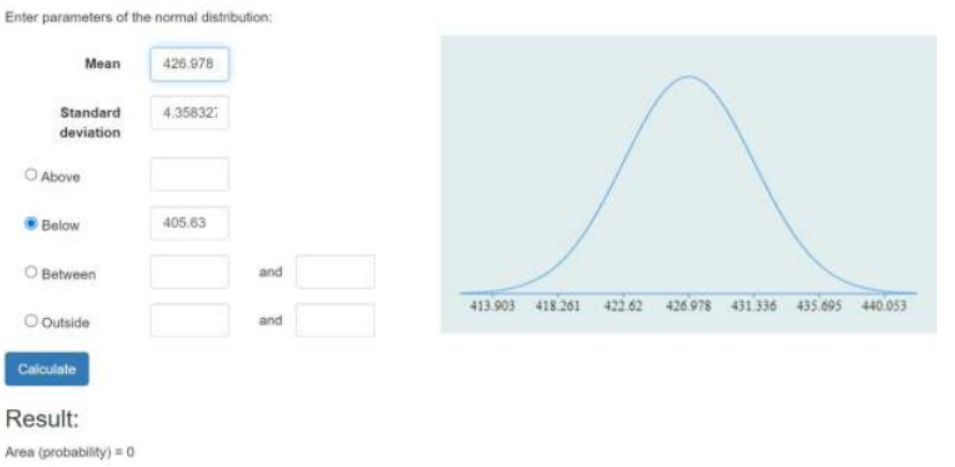
The distribution holds good if the mean, median and mode are equal. The following table shows that they are nearly aligned. Also, for a few other statistics added too to highlight the advantage of XTR.

XTR Vs PF – Analysis on Capsule Population beyond the IP Limits

In the following curve for XTR, the calculated probability of capsules below 406.63 mg capsules is zero. Zero here being a very small value (Actual calculated value for both tails of the bell curve put together is 9.64881E-07).  A similar normal distribution on a PF machine sample gives a probability value of 0.001 at each tail of the bell curve. This means we get a probability of 0.002 capsules beyond the 5% limits. Or, in every 1000 capsules taken randomly, we may come across 2 capsules exceeding the 5% limit (defects)

Considering a sigma level calculation without a 1.5 sigma shift, XTR would comply a 4.9σ. PF would be at 3.66σ.  The exact values considered for probability density curve area for a +/-5% upper and lower limits are: – XTR = 0.964 defects per million and for PF is 247 defect per million. These values are derived from the Gaussian probability density formula and applied to a sigma level calculator.

Conversion Efficiency

It is the ability to convert powders to capsule. If one capsule machine can convert the input powders to more capsules than the other for a given time, then the former has a better conversion efficiency than that latter.

For an input material of 10kg in each of the machines, 11.8% more capsules were generated in XTR in comparison to PF. In Table 1.1 when PF generates 20428 capsules, XTR generate 22850 capsules. This is because PF loses more powder (usable and reusable) in the process of conversion. Thus, XTR runs at 11.8 % lesser time for a given production target. E.g. For an 8-hour run of PF, the equivalent run time of XTR is only 7 hours. 

Powder Saving

Normally pharma companies employ the powder recovery method. The powder from the slug tray, machine top and dosing disc are sieved and reused. In the table below (Table 1.1) the ones tagged in yellow may be recovered. The component which cannot be recovered is the wastage in CDU- for both the machines. We see that in XTR, CDU losses are very low. For a 10kg input, 0.161 kg is the differential loss in CDU for PF. This corresponds to 1.61% irreversible loss of powder in PF. This means that, for a 20 lacs campaign batch (approx. powder weight of 1000 kg), we save about 16.1 kg powder which cannot be recovered from PF at all. Some pharma companies discard the entire leftover power and do not reuse. In this case, the savings would be nearly 5%, if XTR is used.

Conclusion

1) Statistical analysis on XTR clarifies its superiority over conventional capsule fillers in terms to extremely low number of capsules which are beyond the IP limits of +/- 5% of the average weight. This is an outcome of the narrower standard deviation of XTR Vs PF.

2) XTR can save powder and improve operational time due to much lower powder loss, better weight control and higher capsules produced per unit time when compared to conventional fillers.

Overall, it would be a better bet in terms of improving powder saving, time efficiency and weight accuracy if XTR is put on the production floor.

The author is Business Head, Packaging Division of Parle Global Technologies.  He has been working on sales, marketing and product development of various packing machines for about 2 decades.

 (By Sunil Kumar K.V)